
Immigrant New Jersey
Anthony
July 27, 2016
Whether your ancestors settled here long ago (like some of mine), your great-grandparents stepped off a boat onto Ellis Island (like the rest of mine), or you or your parents landed at Newark Airport, every Jersey family tree was planted somewhere else. Most of us once were foreigners. New Jerseyans trace their roots to every country you can name, and we’re fiercely proud of that. At a time when presumptive political leaders peddle fear and blame immigrants for every societal problem, New Jersey draws strength from our immigrant past and present.
New Jersey’s ethnic diversity is broad and deep – a dynamic mix of first-generation immigrants and the descendants of immigrants. New Jersey ranks 11th among states by population, but 3rd (after California and New York) by percentage of foreign-born residents.
One in five of New Jersey’s almost 9 million people is an immigrant.
All of the state’s population growth since 2010, in fact, is attributable to foreign-born immigration. New Jersey also happens to have the third highest per capita income in the United States. Notably, one-third of all New Jersey business owners are foreign-born, with almost half of “Main Street” businesses – like restaurants – owned by immigrants. Often excluded from other opportunities, first-generation immigrants succeed through hard work. They get the job done.
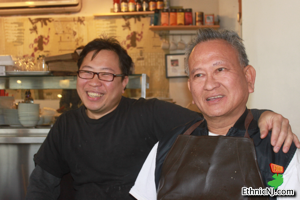
New Barbecue Pit – Bergenfield, NJ
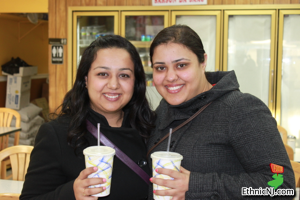
Jassi Sweets – Iselin, NJ
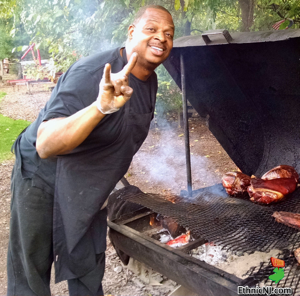
Rodgers Real BBQ – Avenel, NJ
Earlier immigrants have passed their ethnic identities to subsequent Jersey-born generations. Italian (16%) is the ancestry most frequently claimed by New Jerseyans, followed by Irish (14%), African (14%), German (11%), Polish (5%), and Puerto Rican (5%).
New immigrants continue to arrive. New Jersey is home to the most Cuban-Americans outside of Florida, the third largest Peruvian, Indian and Korean populations in the country, and the fourth largest Chinese population in the United States. New Jersey is the only state where residents born in India make up the largest share (11%) of the foreign-born population, followed by people from the Dominican Republic (7%), Mexico (6%), Africa (4%), China (4%), Philippines (4%), Ecuador (4%), and Colombia (4%). New Jersey towns and counties have some of the nation’s largest concentrations of foreign-born residents, like the first-generation immigrant communities in Kearny (Peruvian), Jersey City (Indian, Filipino), Newark (Brazilian, Portuguese), Paterson (Middle Eastern), Atlantic County (Vietnamese), Bergen County (Cuban, Korean), Essex County (Caribbean) and Middlesex County (South Asian, Chinese). We are, after all, the most densely populated state in the country,
As a result, New Jersey’s population is remarkably diverse, by culture, by language, by race and by religion. In the Census, New Jerseyans report 106 different ancestries, often multiple, and were born in 114 different countries. Beyond English, many New Jerseyans speak Spanish, Cantonese, Mandarin, Italian, Portuguese, Tagalog, Gujarati, Polish, Hindi and Arabic. Rutgers, the State University, is one of the country’s most international, with students from 63 countries. New Jersey has the second-highest share of Jewish residents (after New York), and of Muslim residents (after Michigan).
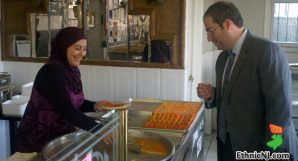
Nablus Pastry – Paterson, NJ
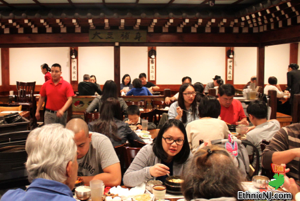
Soft Tofu Restaurant – Fort Lee, NJ
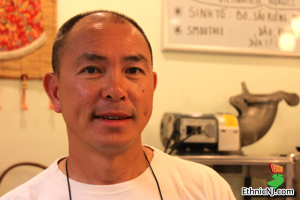
Hủ Tiếu Miền Tây – Pleasantville, NJ
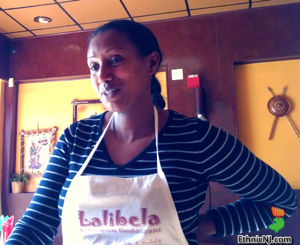
Lalibela – South Orange, NJ
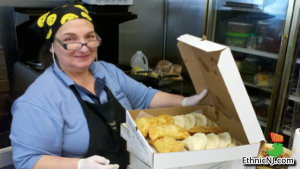
Stella’s Empanadas – Kearny, NJ
In New Jersey, you see the demographic changes reshaping the United States.
The share of Latinos (18%), African-Americans (14%), and Asians (8%) in New Jersey is growing. New Jersey has the seventh largest Hispanic population in the United States. The US Census Bureau estimates that by 2043, the United States will become a “minority-majority” nation, as non-Hispanic “whites” will account for less than half the population. Five of New Jersey’s twenty-one counties – Essex, Union, Passaic, Middlesex and Cumberland – are already minority-majority. While our ethnic diversity does not yet mean a consistent level of integration across the state, it does mean people of many backgrounds living, learning, working (and eating) together.
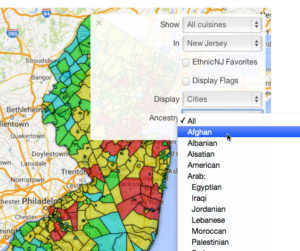
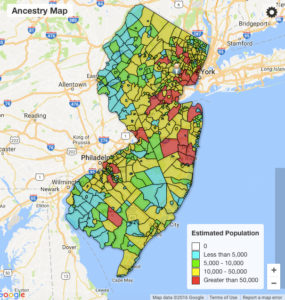
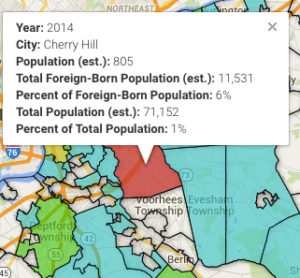
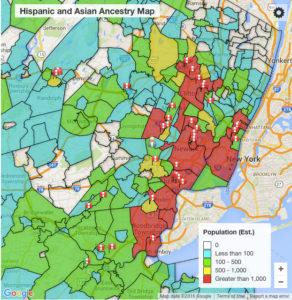
EthnicNJ maps Jersey diversity. EthnicNJ’s interactive NJ Demographic Maps illustrate the ethnic roots of New Jersey’s population, displaying ancestry and place of birth information for each of New Jersey’s 21 counties and for 570 individual towns.
As part of an initiative by NJ Spotlight and Montclair State University’s Center for Cooperative Media to tell the story of New Jersey’s immigrant communities, EthnicNJ has updated its Ancestry and Place of Birth Maps with the most recent US Census population estimates.
New map features include:
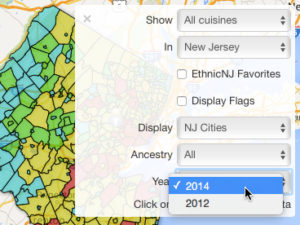
- The ability to toggle between 5-year population estimates for 2012 and 2014
- Population percentages for every geography
- Population estimates for the State as a whole
Use the EthnicNJ Ancestry Map to see the 106 different ancestries reported by New Jerseyans, from Afghan to Yugoslavian, and where they live. Use the EthnicNJ Place of Birth Map to see the 114 countries (and 46 regions) of birth of New Jersey’s foreign-born population.
Viewed together, EthnicNJ’s food and demographic maps paint a powerful picture of New Jersey communities. EthnicNJ has mapped over 1100 restaurants serving some 60 different cuisines.
Ethnic diversity is as Jersey as an Italian hot dog, a taco al pastór, a masala dosa, kimchi, roti, lechón, pão de queijo, báhn mì, an arepa, a slider or a slice.
Food follows people. Display the EthnicNJ restaurant markers on the ancestry or place of birth map, for example, and you’ll see Peruvian restaurants following Peruvian-Americans from first-generation immigrant communities like Kearny, into the Jersey suburbs. You can see similar migrations for Portuguese, Indian and Vietnamese food. Urban neighborhoods once home to first-generation Italians, like Trenton‘s Chambersburg or Newark‘s Ironbound, are now good places to find restaurants serving first-generation Guatemalans and Salvadorans, or Portuguese and Brazilians, respectively.
New Jersey has always been EthnicNJ. That’s who we are. That’s why we live here.

 BBQ
BBQ Brazilian
 British
 Chinese
 Costa Rican
 Cuban
Cuban Deli (Jewish)
 Diner
Diner Ethiopian
 Filipino
 German
 Indian
 Irish
Irish Italian
 Jamaican
 Japanese
 Korean
 Mexican
 Middle Eastern
 Persian
 Peruvian
 Portuguese
 Taiwanese
 Thai
Thai Trinidadian
 Turkish
 Vietnamese

[…] Great Falls National Park is doing on a smaller scale: using food as a common language to connect immigrant New Jersey’s present to the Falls, the Park and Paterson’s […]